
How to Measure DRT Success: Key Metrics and What They Reveal
Launching a Demand-Responsive Transport (DRT) service is a bold step—but what defines its success? While ridership growth is important, there’s much more to the story. Measuring performance requires a mix of operational, technical, and user-centered indicators.
Here are the most relevant metrics Shotl recommends tracking—along with what they reveal about your service’s health and potential.
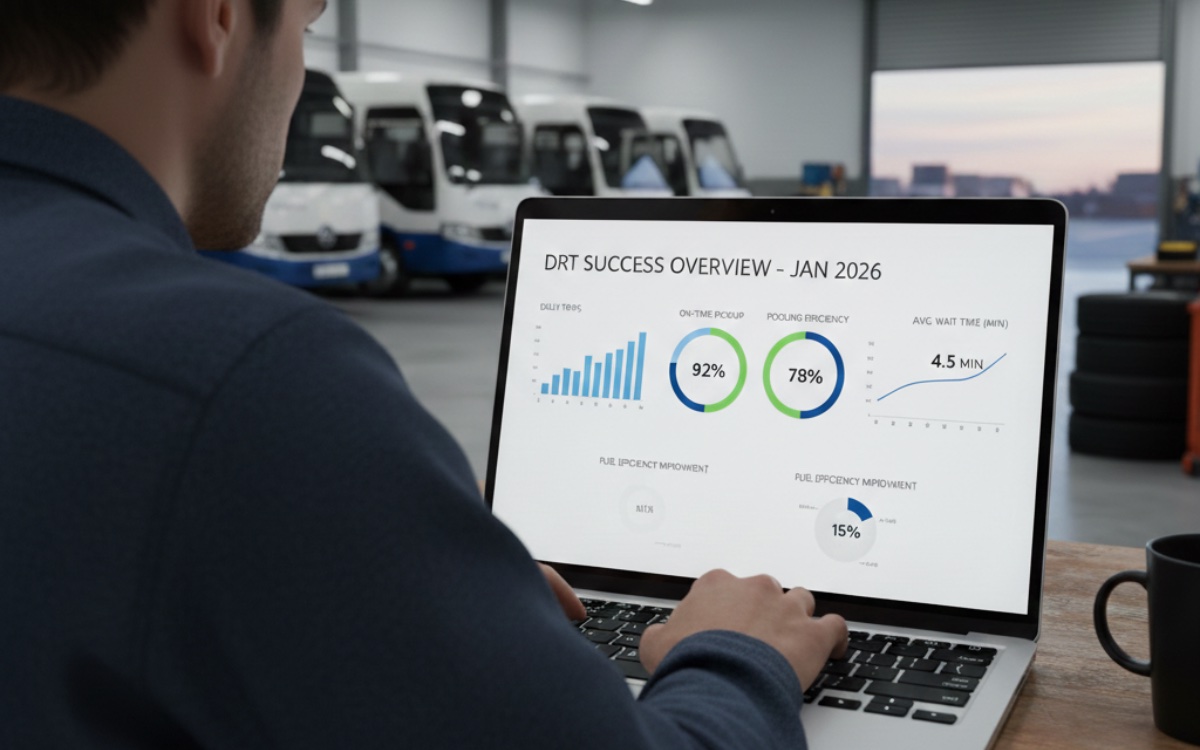
1. Average Waiting Time
This is one of the most immediate indicators of user experience. Long wait times discourage adoption, while stable or improving wait times show that supply is matching demand. Segmenting by time of day or zone can also reveal service gaps or overcrowding.
2. Booking Success Rate
What percentage of ride requests are fulfilled? A high rejection rate could signal:
- Under-resourced fleets
- Overly restrictive algorithm parameters
- Demand exceeding capacity at peak hours
Monitoring this metric helps identify when and where the system needs to expand or adjust.
3. Occupancy per Vehicle-Hour
This shows how effectively vehicles are being used. It’s calculated by dividing total passengers by active vehicle hours. Higher occupancy means better cost-efficiency and environmental impact.
4. Pooling Rate
How many rides are shared? A high pooling rate reflects optimized routing and contributes to fewer emissions and reduced congestion. Lower rates may suggest poor spatial overlap or overly conservative detour settings.
5. Cancellation Rate
This includes both user-initiated and system-triggered cancellations. It’s useful for identifying issues with:
- User trust and satisfaction
- Scheduling inaccuracies
- Long estimated arrival times
6. Net Promoter Score (NPS)
This is a direct measure of user satisfaction. Asking passengers “How likely are you to recommend this service to a friend?” and tracking changes over time gives qualitative insight that complements quantitative KPIs.
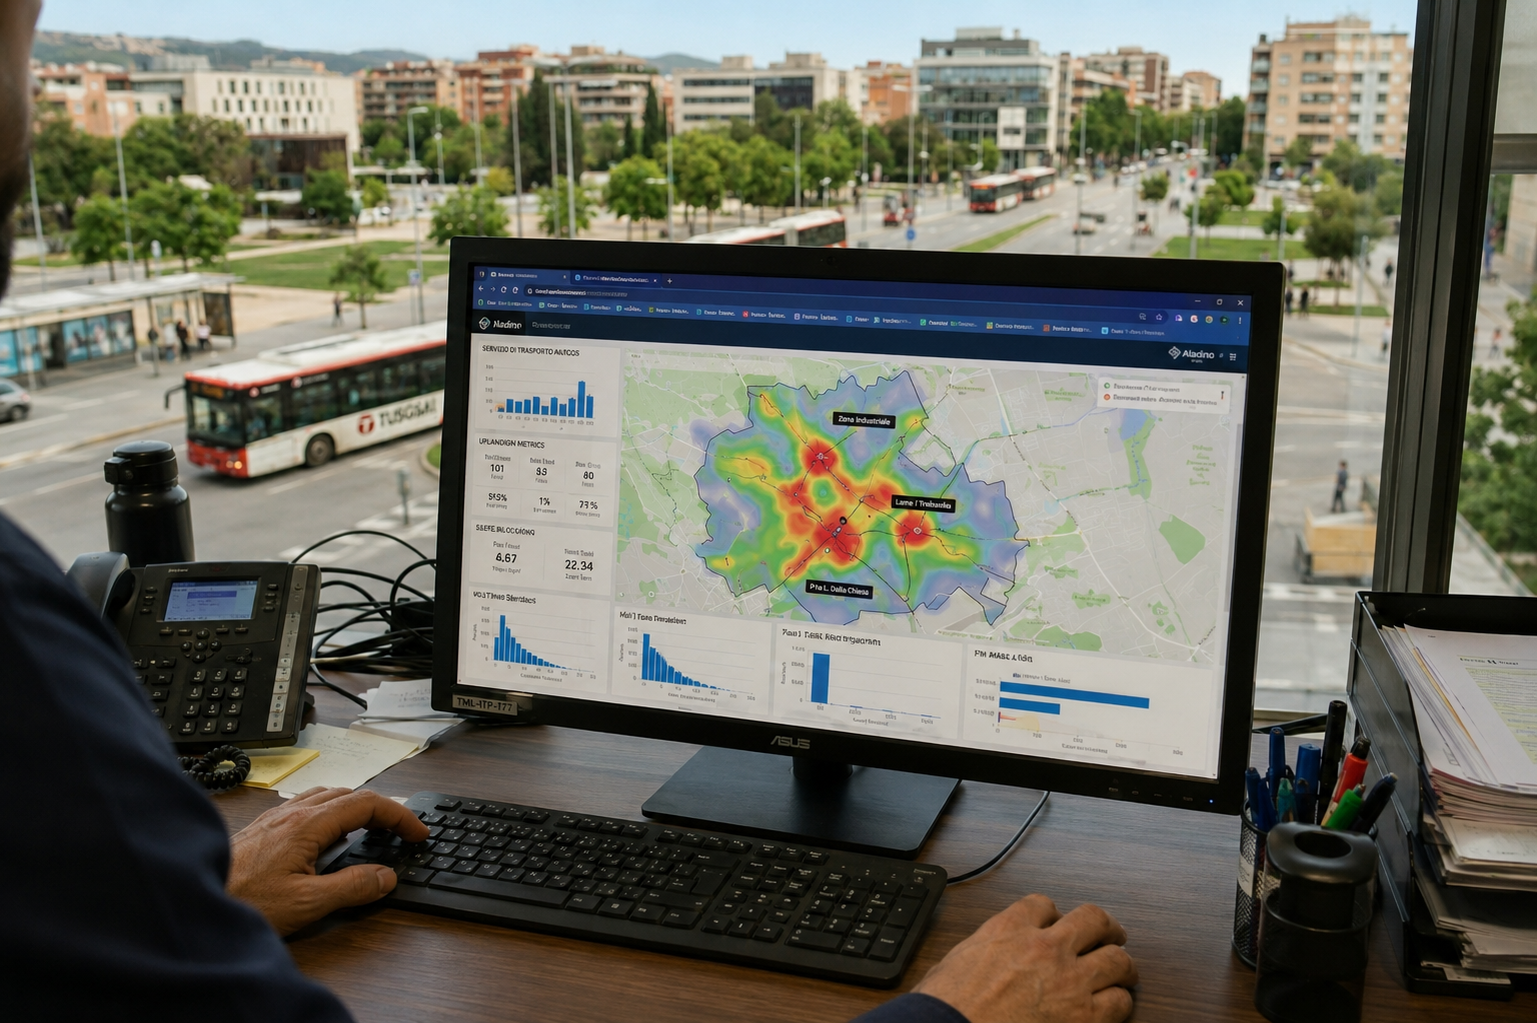
7. Coverage and Equity Indicators
Are all parts of your service area being served fairly? Are marginalized or low-mobility populations using the service? By analyzing heatmaps of origin/destination activity, you can evaluate if DRT is delivering inclusive mobility.
8. Cost per Trip or per Passenger-Kilometer
This helps cities assess financial sustainability. Compare it with traditional lines or paratransit options. Over time, efficiency gains should drive this cost downward, especially as occupancy improves.
9. On-Time Performance
Even in flexible systems, users value reliability. Measuring adherence to promised pickup windows builds trust and helps fine-tune the algorithm.
Conclusion
DRT is data-rich by nature—but knowing what to measure is key. With the right metrics and dashboards, operators and municipalities can ensure that the service evolves intelligently, delivers on its promises, and earns lasting public trust.
Popular posts

27.07.20
Electric Vehicles – Cleaner, Greener and... On-Demand?
Electric vehicle sales continue to grow year on year but there’s still a way to go before they overtake combustion engines. Now, though, new electric minivans could provide opportunities for cleaner local transport.
Osvald Martret

30.08.21
On-demand Ridepooling in Málaga, Spain
The operation began on October 8th 2018 and it is available for over 30,000 people, living on the west side of Málaga.
Sílvia Coronado
29.06.26
How to Include Demand Responsive Transport Software in a Public Tender
A practical guide for public authorities on procuring DRT software, covering tender models, booking channels, KPIs, data ownership, integrations, accessibility, implementation and provider evaluation.